
Redis: get/scan/iterate all keys
Iterating over keys
It's not recommended to use the KEYS prefix:* command to get all the keys in a Redis instance, especially in production environments, because it can be a slow and resource-intensive operation that can impact the performance of the Redis instance.
Instead, you can iterate over Redis keys that match some pattern using the SCAN command:
var cursor uint64
for {
	var keys []string
	var err error
	keys, cursor, err = rdb.Scan(ctx, cursor, "prefix:*", 0).Result()
	if err != nil {
		panic(err)
	}

	for _, key := range keys {
		fmt.Println("key", key)
	}

	if cursor == 0 { // no more keys
		break
	}
}
go-redis allows to simplify the code above to:
iter := rdb.Scan(ctx, 0, "prefix:*", 0).Iterator()
for iter.Next(ctx) {
	fmt.Println("keys", iter.Val())
}
if err := iter.Err(); err != nil {
	panic(err)
}
Sets and hashes
You can also iterate over set elements:
iter := rdb.SScan(ctx, "set-key", 0, "prefix:*", 0).Iterator()
And hashes:
iter := rdb.HScan(ctx, "hash-key", 0, "prefix:*", 0).Iterator()
iter := rdb.ZScan(ctx, "sorted-hash-key", 0, "prefix:*", 0).Iterator()
Cluster and Ring
If you are using Redis Cluster or Redis Ring, you need to scan each cluster node separately:
err := rdb.ForEachMaster(ctx, func(ctx context.Context, rdb *redis.Client) error {
	iter := rdb.Scan(ctx, 0, "prefix:*", 0).Iterator()

	...

	return iter.Err()
})
if err != nil {
	panic(err)
}
Delete keys without TTL
You can also use SCAN to delete keys without a TTL:
iter := rdb.Scan(ctx, 0, "", 0).Iterator()

for iter.Next(ctx) {
	key := iter.Val()

    d, err := rdb.TTL(ctx, key).Result()
    if err != nil {
        panic(err)
    }

    if d == -1 { // -1 means no TTL
        if err := rdb.Del(ctx, key).Err(); err != nil {
            panic(err)
        }
    }
}

if err := iter.Err(); err != nil {
	panic(err)
}
For a more efficient version that uses pipelines see the example.
Monitoring Performance
Monitoring the performance of a Redis database is crucial for maintaining the overall health, efficiency, and reliability of your system. Proper performance monitoring helps identify and resolve potential issues before they lead to service disruptions or performance degradation.
Uptrace is a OpenTelemetry backend that supports distributed tracing, metrics, and logs. You can use it to monitor applications and troubleshoot issues.
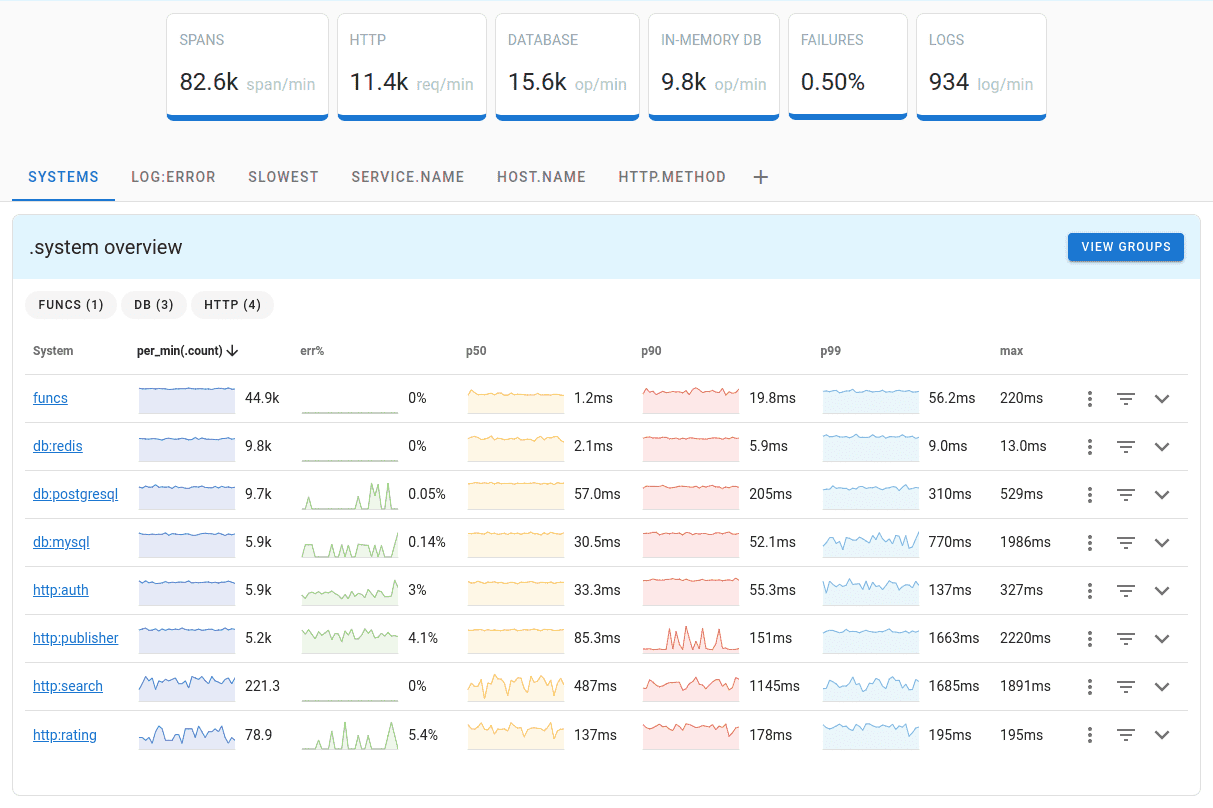
Uptrace comes with an intuitive query builder, rich dashboards, alerting rules with notifications, and integrations for most languages and frameworks.
Uptrace can process billions of spans and metrics on a single server and allows you to monitor your applications at 10x lower cost.
In just a few minutes, you can try Uptrace by visiting the cloud demo (no login required) or running it locally with Docker. The source code is available on GitHub.