
Debugging Go Redis
Connection pool size
To improve performance, go-redis automatically manages a pool of network connections (sockets). By default, the pool size is 10 connections per every available CPU as reported by runtime.GOMAXPROCS. In most cases, that is more than enough and tweaking it rarely helps.
rdb := redis.NewClient(&redis.Options{
    PoolSize: 1000,
})
redis: connection pool timeout
You can get that error when there are no free connections in the pool for Options.PoolTimeout duration. If you are using redis.PubSub or redis.Conn, make sure to properly release PuSub/Conn resources by calling Close method when they are not needed any more.
You can also get that error when Redis processes commands too slowly and all connections in the pool are blocked for more than PoolTimeout duration.
Timeouts
Even if you are using context.Context deadlines, do NOT disable DialTimeout, ReadTimeout, and WriteTimeout, because go-redis executes some background checks without using a context and instead relies on connection timeouts.
If you are using cloud providers like AWS or Google Cloud, don't use timeouts smaller than 1 second. Such small timeouts work well most of the time, but fail miserably when cloud is slower than usually. See Go Context timeouts can be harmful for details.
Also see Context deadline exceeded if you are getting such error.
Large number of open connections
Under high load, some commands will time out and go-redis will close such connections because they can still receive some data later and can't be reused. Closed connections are first put into TIME_WAIT state and remain there for double maximum segment life time which is usually 1 minute:
cat /proc/sys/net/ipv4/tcp_fin_timeout
60
To cope with that, you can increase read/write timeouts or upgrade your servers to handle more traffic. You can also increase the maximum number of open connections, but that will not make your servers or network faster.
Also see Coping with the TCP TIME-WAIT for some advices.
Pipelines
Because go-redis spends most of the time writing/reading/waiting data from connections, you can improve performance by sending multiple commands at once using pipelines.
Cache
If your app logic does not allow using pipelines, consider adding a local in-process cache for the most popular operations, for example, using TinyLFU.
Hardware
Make sure that your servers have good network latency and fast CPUs with large caches. If you have multiple CPU cores, consider running multiple Redis instances on a single server.
See Factors impacting Redis performance for more details.
Sharding
You can also split data across multiple Redis instances so that each instance contains a subset of the keys. This way the load is spread across multiple servers and you can increase performance by adding more servers.
Redis Ring is a good option if you are using Redis for caching and can afford losing some data. Otherwise, you can try Redis Cluster.
Monitoring
Monitoring the performance of a Redis database is crucial for maintaining the overall health, efficiency, and reliability of your system. Proper performance monitoring helps identify and resolve potential issues before they lead to service disruptions or performance degradation.
Uptrace is a OpenTelemetry backend that supports distributed tracing, metrics, and logs. You can use it to monitor applications and troubleshoot issues.
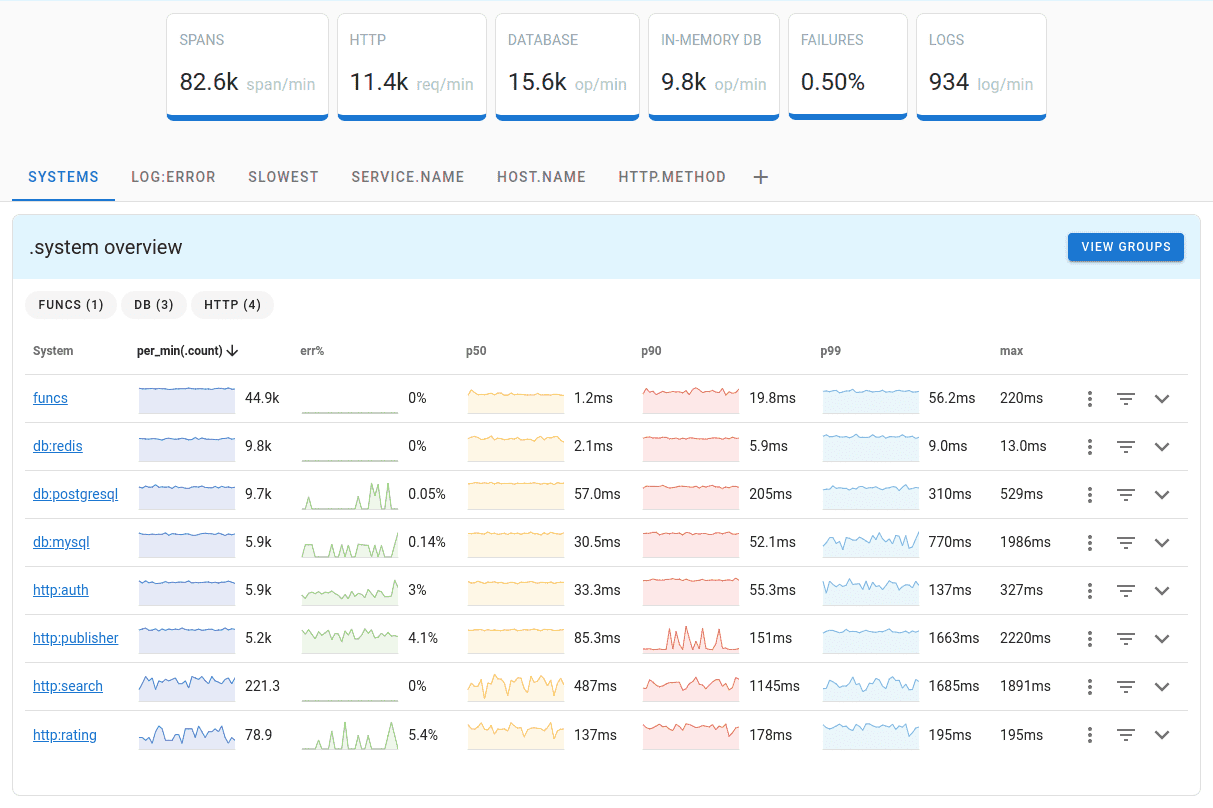
Uptrace comes with an intuitive query builder, rich dashboards, alerting rules with notifications, and integrations for most languages and frameworks.
Uptrace can process billions of spans and metrics on a single server and allows you to monitor your applications at 10x lower cost.
In just a few minutes, you can try Uptrace by visiting the cloud demo (no login required) or running it locally with Docker. The source code is available on GitHub.