
Golang Redis Cache
Redis config
To start using Redis as a cache storage, use the following Redis config:
# Required
##########

# Set a memory usage limit to the specified amount of bytes.
# When the memory limit is reached Redis will try to remove keys
# according to the eviction policy selected (see maxmemory-policy).
maxmemory 100mb

# Optional
##########

# Evict any key using approximated LFU when maxmemory is reached.
maxmemory-policy allkeys-lfu

# Enable active memory defragmentation.
activedefrag yes

# Don't save data on the disk because we can afford to lose cached data.
save ""
go-redis/cache
go-redis/cache library implements a cache using Redis as a key/value storage. It uses MessagePack to marshal values.
You can install go-redis/cache with:
go get github.com/go-redis/cache/v8
go-redis/cache accepts an interface to communicate with Redis and thus supports all types of Redis clients that go-redis provides.
rdb := redis.NewClient(&redis.Options{
    Addr: "localhost:6379",
})

mycache := cache.New(&cache.Options{
    Redis: rdb,
})

obj := new(Object)
err := mycache.Once(&cache.Item{
    Key:   "mykey",
    Value: obj, // destination
    Do: func(*cache.Item) (interface{}, error) {
        return &Object{
            Str: "mystring",
            Num: 42,
        }, nil
    },
})
if err != nil {
    panic(err)
}
You can also use local in-process storage to cache the small subset of popular keys. go-redis/cache comes with TinyLFU, but you can use any other cache algorithm that implements the interface.
mycache := cache.New(&cache.Options{
    Redis:      rdb,
    // Cache 10k keys for 1 minute.
    LocalCache: cache.NewTinyLFU(10000, time.Minute),
})
Cache monitoring
If you are interested in monitoring cache hit rate, see the guide for Monitoring using OpenTelemetry Metrics.
Monitoring Performance
Monitoring the performance of a Redis database is crucial for maintaining the overall health, efficiency, and reliability of your system. Proper performance monitoring helps identify and resolve potential issues before they lead to service disruptions or performance degradation.
Uptrace is a Grafana alternative that supports distributed tracing, metrics, and logs. You can use it to monitor applications and troubleshoot issues.
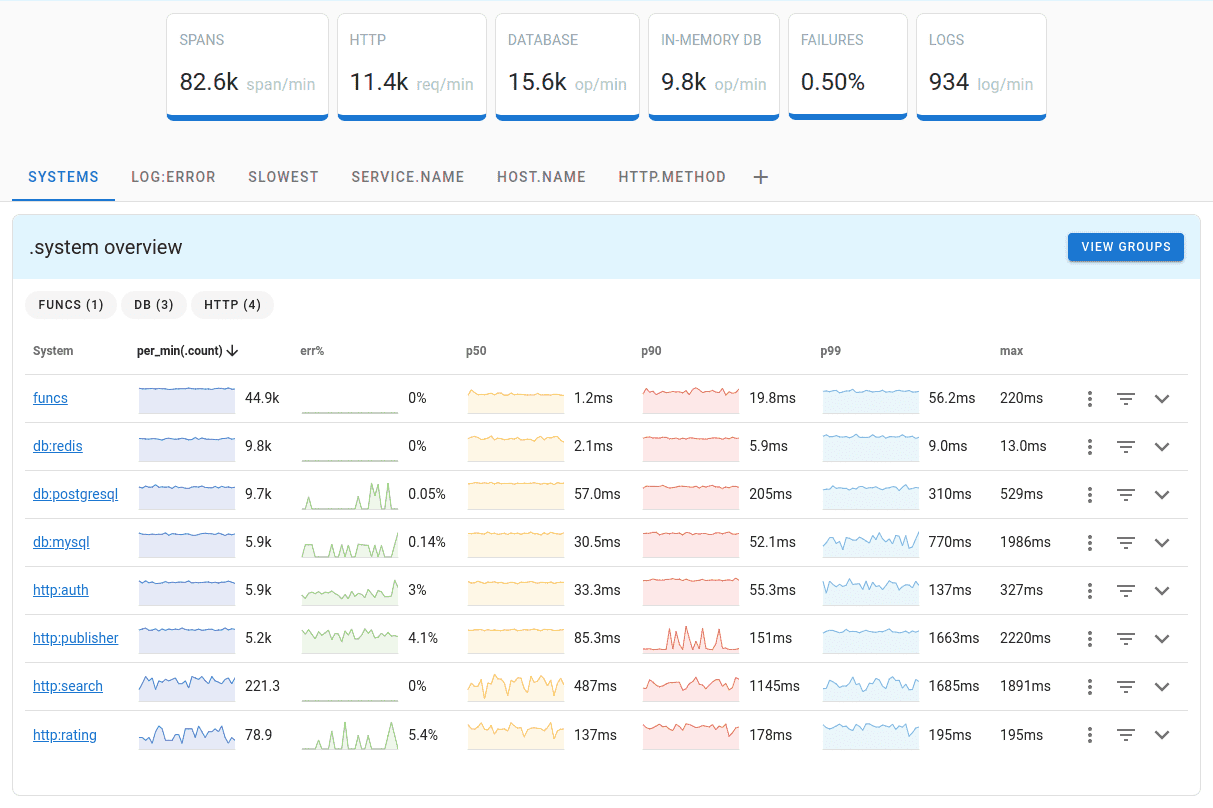
Uptrace comes with an intuitive query builder, rich dashboards, alerting rules with notifications, and integrations for most languages and frameworks.
Uptrace can process billions of spans and metrics on a single server and allows you to monitor your applications at 10x lower cost.
In just a few minutes, you can try Uptrace by visiting the cloud demo (no login required) or running it locally with Docker. The source code is available on GitHub.