Monitoring Golang Redis Performance and Errors
This document explains how to monitor Go Redis client performace using OpenTelemetry.
What is OpenTelemetry?
OpenTelemetry is an open-source observability framework for OpenTelemetry tracing (including logs and errors) and OpenTelemetry metrics.
OpenTelemetry aims to simplify and standardize the process of instrumenting and observing software, making it easier to gain insights into the performance, behavior, and health of distributed systems.
OpenTelemetry is designed to be vendor-agnostic and works across multiple programming languages, frameworks, and environments. It offers a range of language-specific SDKs and instrumentation libraries that make it easier to integrate telemetry collection into your applications.
OpenTelemetry also provides exporters and integrations to send telemetry data to various OpenTelemetry backend systems and observability platforms, including popular tools like Prometheus, Grafana, Jaeger, Zipkin, Elasticsearch, and more.
OpenTelemetry instrumentation
go-redis comes with an OpenTelemetry Redis instrumentation called redisotel that is distributed as a separate module:
go get github.com/redis/go-redis/extra/redisotel/v9
To instrument Redis client, you need to add the hook provided by redisotel. The same methods can be used to instrument redis.Client, redis.ClusterClient, and redis.Ring.
import (
    "github.com/redis/go-redis/v9"
    "github.com/redis/go-redis/extra/redisotel/v9"
)

rdb := redis.NewClient(&redis.Options{...})

// Enable tracing instrumentation.
if err := redisotel.InstrumentTracing(rdb); err != nil {
	panic(err)
}

// Enable metrics instrumentation.
if err := redisotel.InstrumentMetrics(rdb); err != nil {
	panic(err)
}
To make tracing work, you must pass the active trace context to go-redis commands, for example:
ctx := req.Context()
val, err := rdb.Get(ctx, "key").Result()
Uptrace
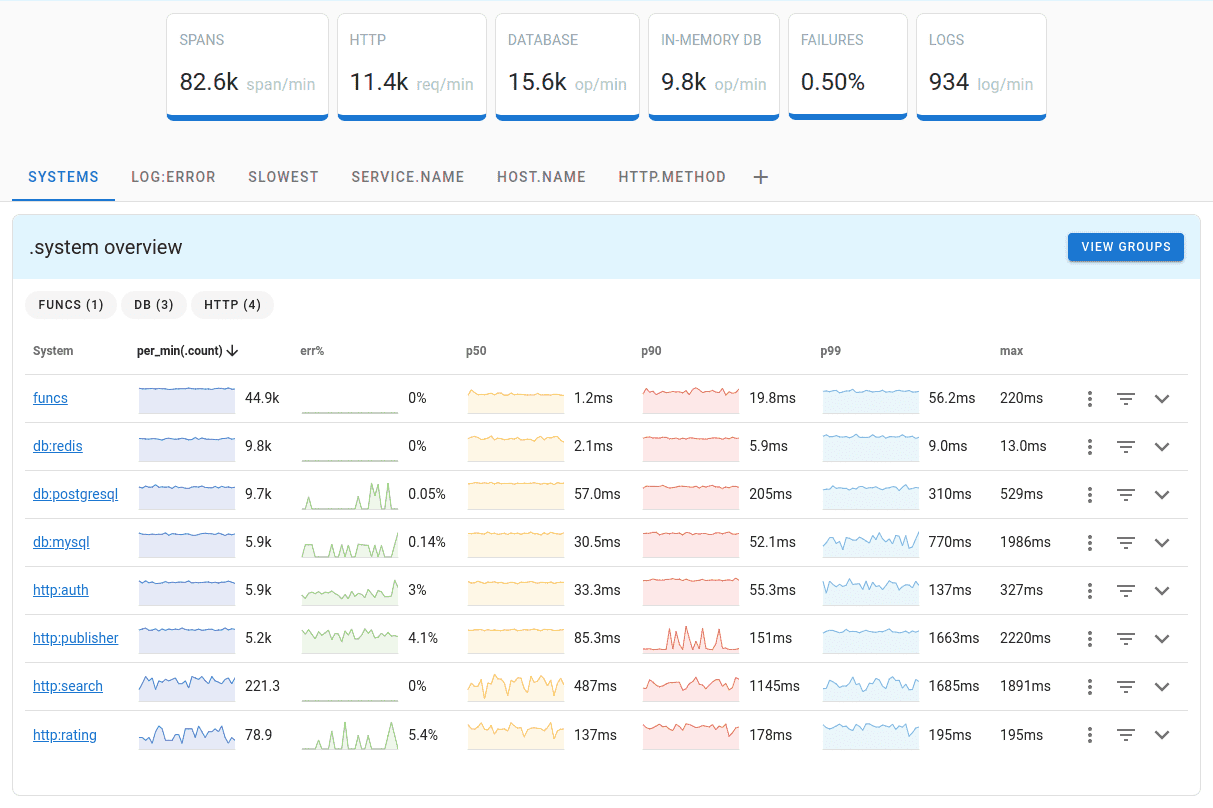
Uptrace is a Grafana alternative that supports distributed tracing, metrics, and logs. You can use it to monitor applications and troubleshoot issues.

Uptrace comes with an intuitive query builder, rich dashboards, alerting rules with notifications, and integrations for most languages and frameworks.
Uptrace can process billions of spans and metrics on a single server and allows you to monitor your applications at 10x lower cost.
In just a few minutes, you can try Uptrace by visiting the cloud demo (no login required) or running it locally with Docker. The source code is available on GitHub.
Prometheus
OpenTelemetry can also integrate with Prometheus, a popular monitoring and alerting system, to collect and export telemetry data.
By integrating OpenTelemetry with Prometheus, you can leverage the powerful monitoring and alerting capabilities of Prometheus while benefiting from the flexibility and standardization provided by OpenTelemetry. This integration enables you to collect, store, visualize, and analyze metrics from your applications and systems, gaining valuable insights into their performance and behavior.
You can send OpenTelemetry metrics to Prometheus using OpenTelemetry Prometheus exporter.
Conclusion
By monitoring Redis performance, you can ensure that your Redis infrastructure operates smoothly, performs optimally, and meets the demands of your applications and users. It allows you to proactively address issues, optimize resource utilization, and maintain the reliability and responsiveness of your Redis deployment.